|
Size: 5182
Comment:
|
← Revision 40 as of 2025-08-05 01:49:59 ⇥
Size: 5181
Comment:
|
| Deletions are marked like this. | Additions are marked like this. |
| Line 59: | Line 59: |
| 1. Filter the Spot Database Display to show only stations in these entities spotted by stations withing (say) 500 miles of your QTH by using an [[https://www.dxlabsuite.com/spotcollector/Help/SpotDatabase.htm#Filtering%20with%20SQL%20expressions|appropriate SQL expression]], in this case {{{(DXCCPrefix in ('ZC4','5B4','TA', 'OD', '4X', 'SY')) and (ODX < 500)}}} | 1. Filter the Spot Database Display to show only stations in these entities spotted by stations within (say) 500 miles of your QTH by using an [[https://www.dxlabsuite.com/spotcollector/Help/SpotDatabase.htm#Filtering%20with%20SQL%20expressions|appropriate SQL expression]], in this case {{{(DXCCPrefix in ('ZC4','5B4','TA', 'OD', '4X', 'SY')) and (ODX < 500)}}} |
Analyzing Propagation From Active DX Stations
SpotCollector can use reports of active DX stations by stations near your QTH to display
- your location's activity on each band by time of day
- your location's activity on each band by continent
- propagation openings between your location and a specific region of the world (or a specific callsign)
You can also direct DXView to scan each band and display current openings on its World Map
Band Activity by Time of Day
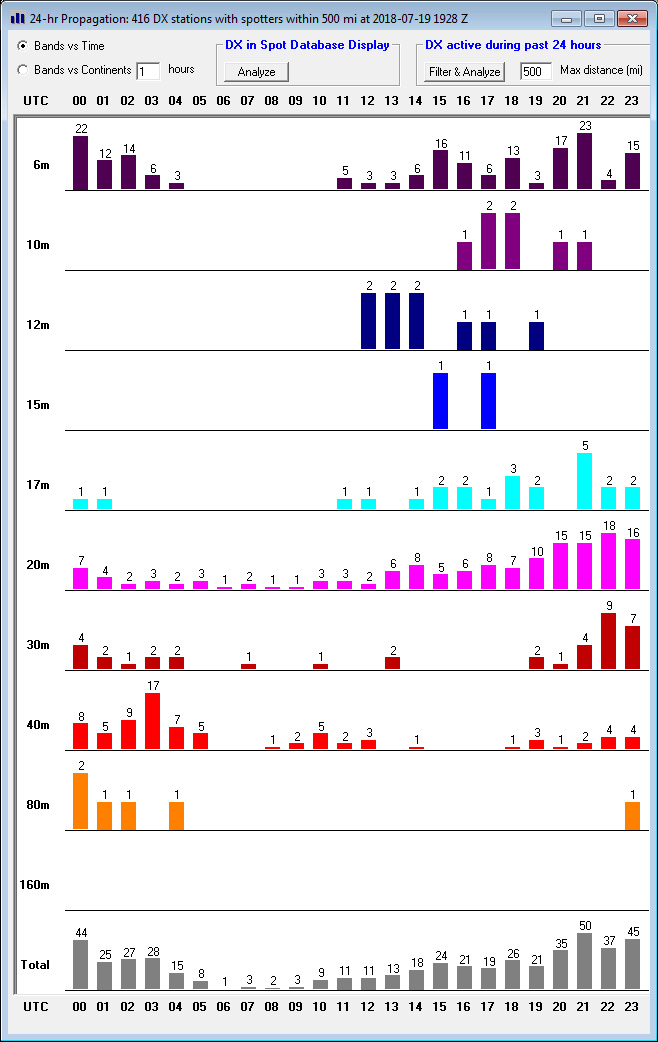
To display a band vs time-of-day analysis of DX stations reported by a station within a specified distance of your QTH,
click the Main window's Prop button to display SpotCollector's Propagation window
click the Propagation window's the Bands vs Time button
in the DX active during the past 24 hours panel, set the Max distance box; only DX stations reported by stations within this distance of your QTH will qualify to be included in the analysis
click the DX active during the past 24 hours panel's Filter & Analyze button
The Propagation window will display a bar chart for each band, with each chart showing the number of qualifying DX stations during each of the day's 24 UTC hours. Double-clicking a bar in these charts will filter the Spot Database Display to show the specific DX stations that were active on that band at that time.

Band Activity by Continent
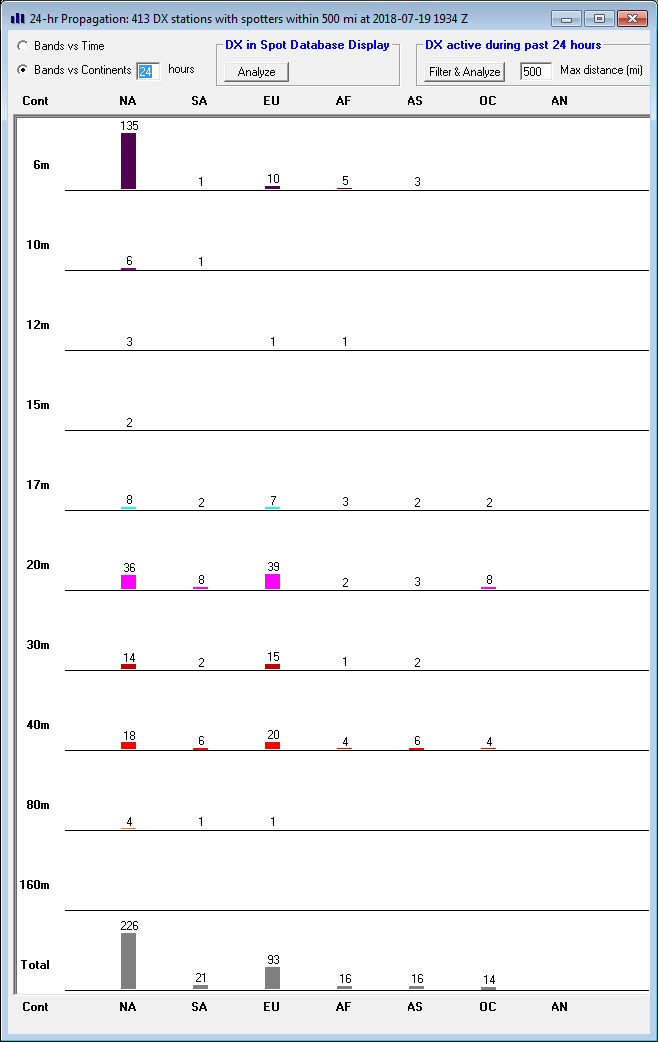
To display a band vs location analysis of DX stations reported by a station within a specified distance of your QTH,
click the Main window's Prop button to display SpotCollector's Propagation window
click the Propagation window's the Bands vs Continents button
specify the analysis interval in the box to the immediate right of the Bands vs Continents button, in hours
in the DX active during the past 24 hours panel, set the Max distance box; only DX stations reported by stations within this distance of your QTH will qualify to be included in the analysis
click the DX active during the past 24 hours panel's Filter & Analyze button.
The Propagation window will display a bar chart for each band, with chart each showing the number of qualifying DX stations by continent. Double-clicking a bar in these charts will filter the Spot Database Display to show the specific DX stations that were active on that band at that time.

Propagation Openings to a Specific Region (or to a Specific Callsign)
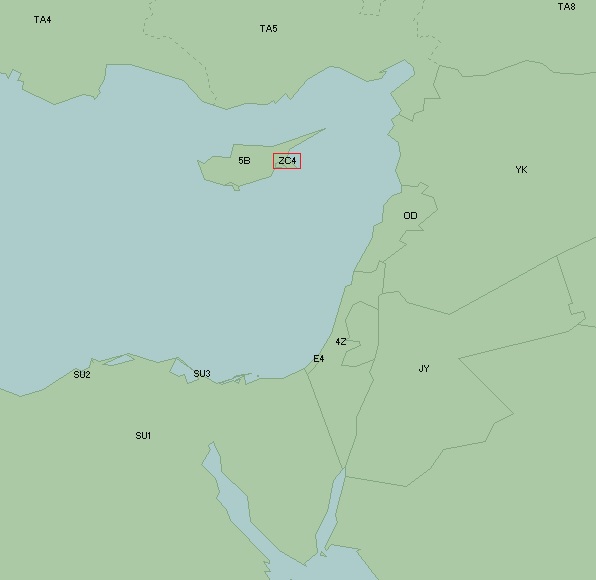
Suppose you are seeking to work a station in the DXCC entity of UK Bases on Cyprus. This entity, whose DXCC prefix is ZC4, is surrounded by the DXCC entities of Cyprus (5B), Turkey (TA), Syria (YK), Lebanon (OD), Israel (4X), Palestine (E4), and Egypt (SU):

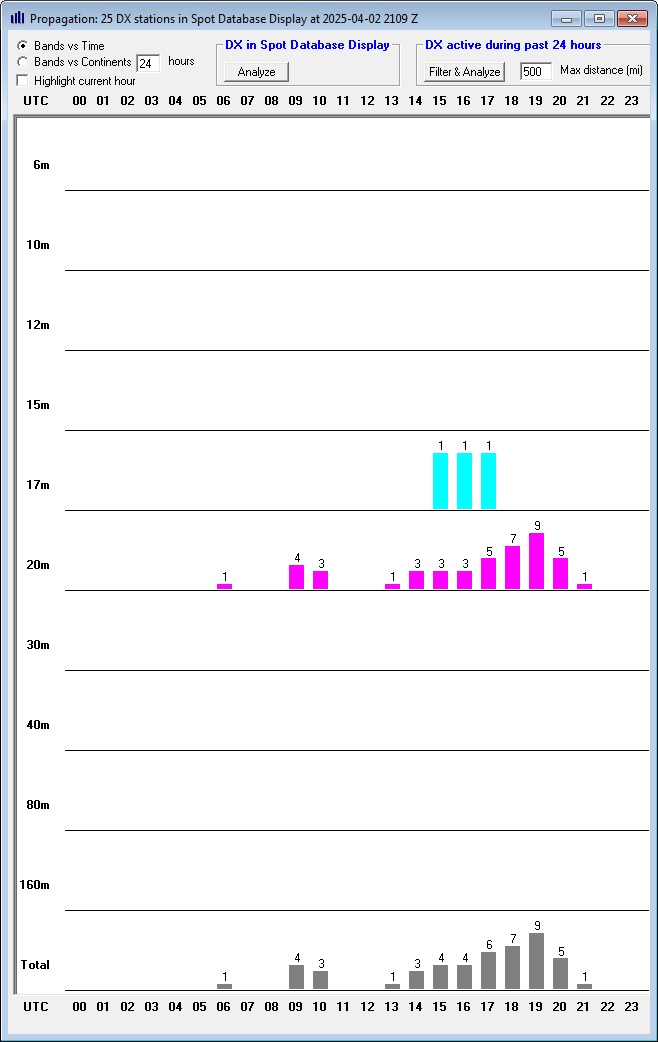
Filter the Spot Database Display to show only stations in these entities spotted by stations within (say) 500 miles of your QTH by using an appropriate SQL expression, in this case (DXCCPrefix in ('ZC4','5B4','TA', 'OD', '4X', 'SY')) and (ODX < 500)
click the Main window's Prop button to display SpotCollector's Propagation window
click the Propagation window's the Bands vs Time button
The resulting display shows on which bands at what times you can expect to work stations in ZC4 (and its surrounding area):
 }
}
If there is a specific callsign in ZC4 you're seeking to work, filter the Spot Database Display to show only spotted activity by this target callsign, and then click the Main window's Prop button to display SpotCollector's Propagation window showing the target callsign's activity by band and time. The intersection of propagation openings and target callsign activity are where to focus your listening.
Scanning Each Band to See Current Openings
DXView's Scan DX function will sequentially scan the bands you've selected, displaying active DX stations and spotting stations on its World Map as shown in this video.
Predicting Propagation
Post a question or suggestion on the DXLab Discussion Group
Hiding Active DX Stations That You Probably Can't Hear
Getting Started with Spot Collection, Active DX Identification, and Analytics
